Trying to better understand your virtual machine's utilization?
Well look no further. Virtual Center 2.5 update 4 (released on Feb 23, 2009) has a great new plug-in that summaries all your virtual machines metrics,

from one convenient screen! If you have used the performance charts in Virtual Center, then you know how difficult they can be to work with. Analyzing a virtual machines performance can be a tedious task, especially when trying to understand capacity and doing trend analysis. Until now, the performance charts were the only tools available to monitor system performance. You would have to navigate through several different charts to understand a virtual machine CPU, memory, I/O and network utilization – quite a lot of work to say the least. New in Virtual Center update 4, is a less well known performance "overview" plug-in that makes virtual machine analysis a breeze. Unfortunately the plug-in doesn't come built-in to Virtual Center. Not to worry though, in the following pages, we will walk you through the steps necessary to install the new performance charts and have you analyzing your virtual machines performance in minutes!
Note: This plug-in is only offered in Virtual Center update 4 (build 147633 or greater). If you are not running VC update 4, you must first upgrade your Virtual Center instance. Please see VMware's release notes for details on upgrading.
We'll begin our installation with Java. If you already have the Java SE development kit installed, you can begin with the section below entitled Configuring Java Environment Variables
Download Java
Download and install the Sun Java SE development kit on your Virtual Center Server. Unless you are an advanced user, select the defaults through the completion of the installer. Take note of the install location as we will need this path later when configuring Java's environment variables.
Configuring Java Environment Variables
We must now set the appropriate environment variables for Java to run correctly on our Virtual Center server.
-
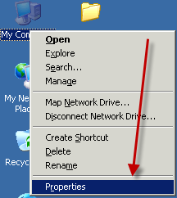
Right-click ‘My Computer’ and click ‘Properties’
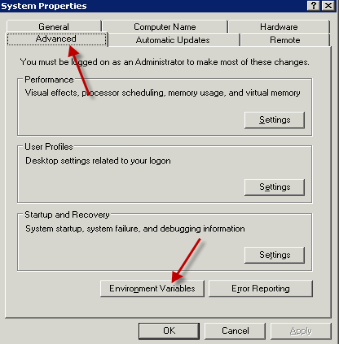
2. From the ‘Advanced’ tab, click ‘Environment Variables’
-
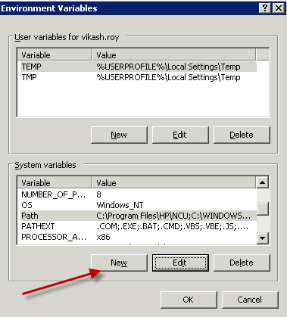
Select the 'Path' system variable and click 'Edit.' Append the location Java was installed from the Download Java section above. If you used the defaults during the installation, this should be ';C:\Program Files\Java\jdk1.6.0_11\bin\'

Note: Ensure to include the ‘;’ – this acts as the delimiter between field elements In the System variable list, click ‘New’
-
In the 'Variable name', enter JAVA_HOME and in 'Variable value', enter 'C:\Program Files\Java\jdk1.6.0_11' or the path where Java was installed (from the Download Java section above)
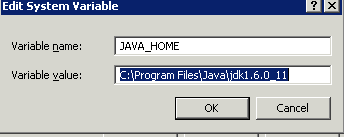
Click through the remaining screens selecting the 'OK' option until the changes have been saved.
-
Click through the remaining screens selecting the 'OK' option until the changes have been saved.
Install Virtual Center Performance Charts
Now that Java is configured, we are ready to install the performance chart plug-in.
-
Open the command prompt on your Virtual Center server:
Start >> Run >> CMD
-
Run install.bat from your VMware Virtual Center installation media:
D:\vpx\perfCharts>install.bat
**************** VMWare Stats Installer ******************************
Usage: install vcUserName vcPassword
vcUserName is the user name you use to log in to the virtual center
vcPassword is the password you use to log into the virtual center
*****************************************************************
D:\vpx\perfCharts>install.bat administrator password
-
Once the installer has completed, run the Virtual Infrastructure client from your desktop
-
Click 'Manage Plugins...' from the Plugins menu
-
On the 'Available' tab, click the 'Download and install...' button on the viClientsScripts plug-in
-
Once the installation has completed, restart the Virtual Infrastructure client
-
From the Plugins Manager, click the 'Installed' tab and click the 'Enabled' check box next to the viClientScripts plugin
-
You can now access the plug-in from the 'Performance Overview' tab in the Virtual Infrastructure client
-
If you install client from VC2.5 U 4 DVD then there is no need of following above steps
Once plugin is installed then you can view under VC for host as well as VM
-